


Driver’s Desk
Car Theft Statistics by City 2026: Hotspots & Safety
569.8 vehicle thefts per 100,000 residents is low enough to suggest improvement and high enough to keep many city drivers exposed. That is the right starting point for reading car theft statistics by city in 2026.
City averages are useful, but they are blunt instruments. A metro area can show a lower theft rate than it did at the recent peak while still containing apartment lots, commuter rail stations, entertainment districts, and street-parking corridors where risk stays concentrated. For car owners, the practical question is narrower. How likely is your vehicle to be targeted where you leave it, and how quickly would you know if someone moved it?
Recent volatility in theft patterns proves the point. Rates have eased from their peak, yet many drivers still face conditions that differ sharply by neighborhood, vehicle type, and parking routine. A Hyundai or Kia owner dealing with known immobilizer-related exposure is managing a different threat than a pickup owner parking near a jobsite overnight, or a late-model SUV owner leaving a vehicle in an airport lot for a week.
That is why this article goes beyond rankings. It examines why some cities remain high-risk, how theft data is measured, where hyper-local trouble spots distort citywide averages, and which countermeasures match each risk profile. For owners who want faster detection instead of finding out hours later, a GPS car tracker with theft awareness features adds a direct layer of control.
The goal is straightforward. Read the numbers like an analyst, then use them like an owner.
The Shifting Landscape of Vehicle Theft in America
A 43% drop from the 2023 peak sounds decisive. For vehicle owners, it is only part of the risk picture.
Across 34 major U.S. cities, motor vehicle theft fell in 2025 from its recent high, but remained above the pre-surge baseline noted earlier. Analysts should read that as a market correction, not a return to older theft conditions. The recent spike exposed how quickly offenders adapt to weak immobilizers, unattended parking routines, and local enforcement gaps. Some of those conditions have eased. Others have shifted to different vehicle types, neighborhoods, and time windows.
That shift changes how owners should read city rankings. A city moving down the list may still have theft pressure concentrated around apartment complexes, commuter parking, nightlife districts, or logistics corridors. A city with improving overall numbers can still produce heavy losses for owners of vulnerable models or for drivers who leave vehicles parked for long, predictable periods.
The longer pattern also matters. As noted earlier, U.S. theft rates declined for years before the recent rebound pushed the problem back into focus. This reversal underscores why city-level rankings deserve more than a quick scan. They help explain where theft has cooled, where it remains persistent, and where local conditions still give offenders an advantage.
Why individual drivers should read the trend carefully
Vehicle theft is rarely a citywide experience in equal measure. It is usually a parking-pattern problem combined with vehicle-specific exposure.
A Hyundai or Kia owner dealing with known immobilizer-related risk faces a different threat than a contractor parking a pickup with tools overnight, or a traveler leaving a late-model SUV in long-term airport parking. Those differences matter because theft risk is shaped by opportunity. Offenders target the vehicles they can move fastest, strip easiest, or resell with the least friction. That is why a broad decline in citywide theft does not automatically reduce your personal risk.
Owners get better results by matching security to routine. Start with where the vehicle sits longest, how visible it is, how fast unauthorized movement would be noticed, and whether the model itself is a common target. For a practical baseline, review vehicle theft awareness guidance and compare it against your daily parking habits.
A falling trend helps. It does not remove the need for fast detection, especially in the micro-areas where theft remains concentrated.
How Car Theft Statistics Are Really Measured
Most rankings look simple. They aren’t. If you want to use car theft statistics by city the way an analyst would, you need to separate volume from rate.
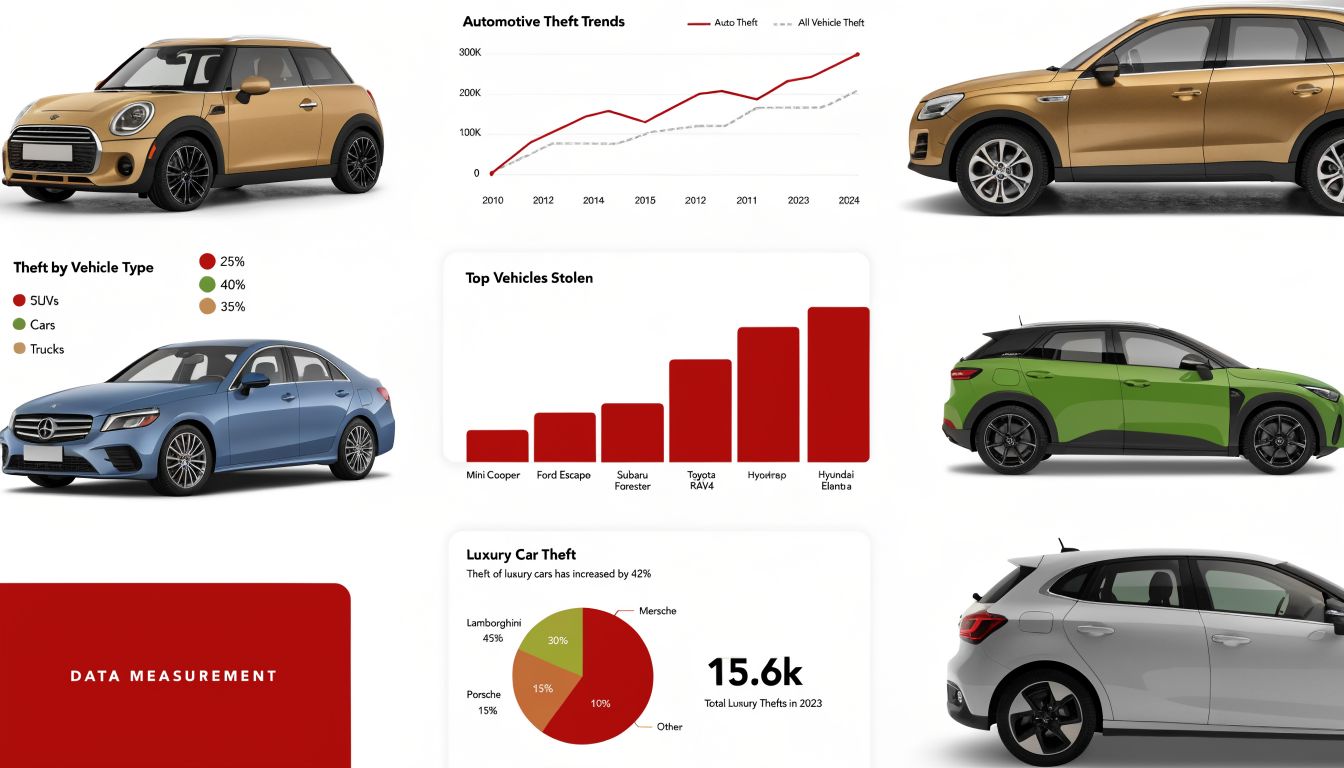
A city with more thefts in raw numbers isn’t automatically the riskier place for an individual owner. Large cities often produce high theft counts because they have more residents and more vehicles. The more useful measure for personal risk is the theft rate per 100,000 residents, because it puts cities on a comparable scale.
Rate versus volume
Think of it this way. One city may report far more stolen vehicles because it’s much larger. Another may report fewer thefts overall but expose each resident to a higher chance of being affected. For risk assessment, the second city can be the sharper warning sign.
That distinction also explains why state totals and city rankings can tell different stories. California, for example, recorded 136,988 thefts with a rate of 427.75 per 100,000, ranking third highest among states in the verified data. That huge volume matters for statewide planning, insurer loss modeling, and law enforcement resources. But if you’re deciding whether your neighborhood commute is unusually exposed, city and sub-city rates are the more actionable lens.
Who produces the numbers
Three types of organizations shape the data most readers encounter:
- Law enforcement reporting systems collect incident reports. Those are the underlying records.
- Analytical groups such as the Council on Criminal Justice normalize data and compare trends across cities.
- Industry-facing groups such as NICB and consumer analysis sites often package hot-spot rankings and model-specific context for a broader audience.
Each has value, but each also has limits. Reported thefts don’t capture incidents that never reach police. City samples aren’t always representative of the entire country. And rankings can mix time periods or geographies if you don’t read the methodology closely.
How to interpret a ranking without overreacting
Use three filters:
- Look for rate first. That’s your best quick signal of exposure.
- Check direction of travel. A city can still rank poorly while improving.
- Ask what geography is being measured. City, metro area, suburb, and state statistics answer different questions.
If you’re using a tracking tool to complement that analysis, a car tracking setup is most useful when paired with an honest map of where your vehicle spends time. The statistic identifies the threat environment. The tracking plan addresses your specific exposure inside it.
A raw total answers “how many thefts happened.” A rate answers “how concentrated the risk is.”
2026 Car Theft Hotspots A City-by-City Breakdown
The most useful city ranking isn’t a simple top-10 list. It combines current rate with recent direction. That reveals whether a city is a persistent hot spot, a place beginning to cool, or a location where volatility itself is the warning sign.
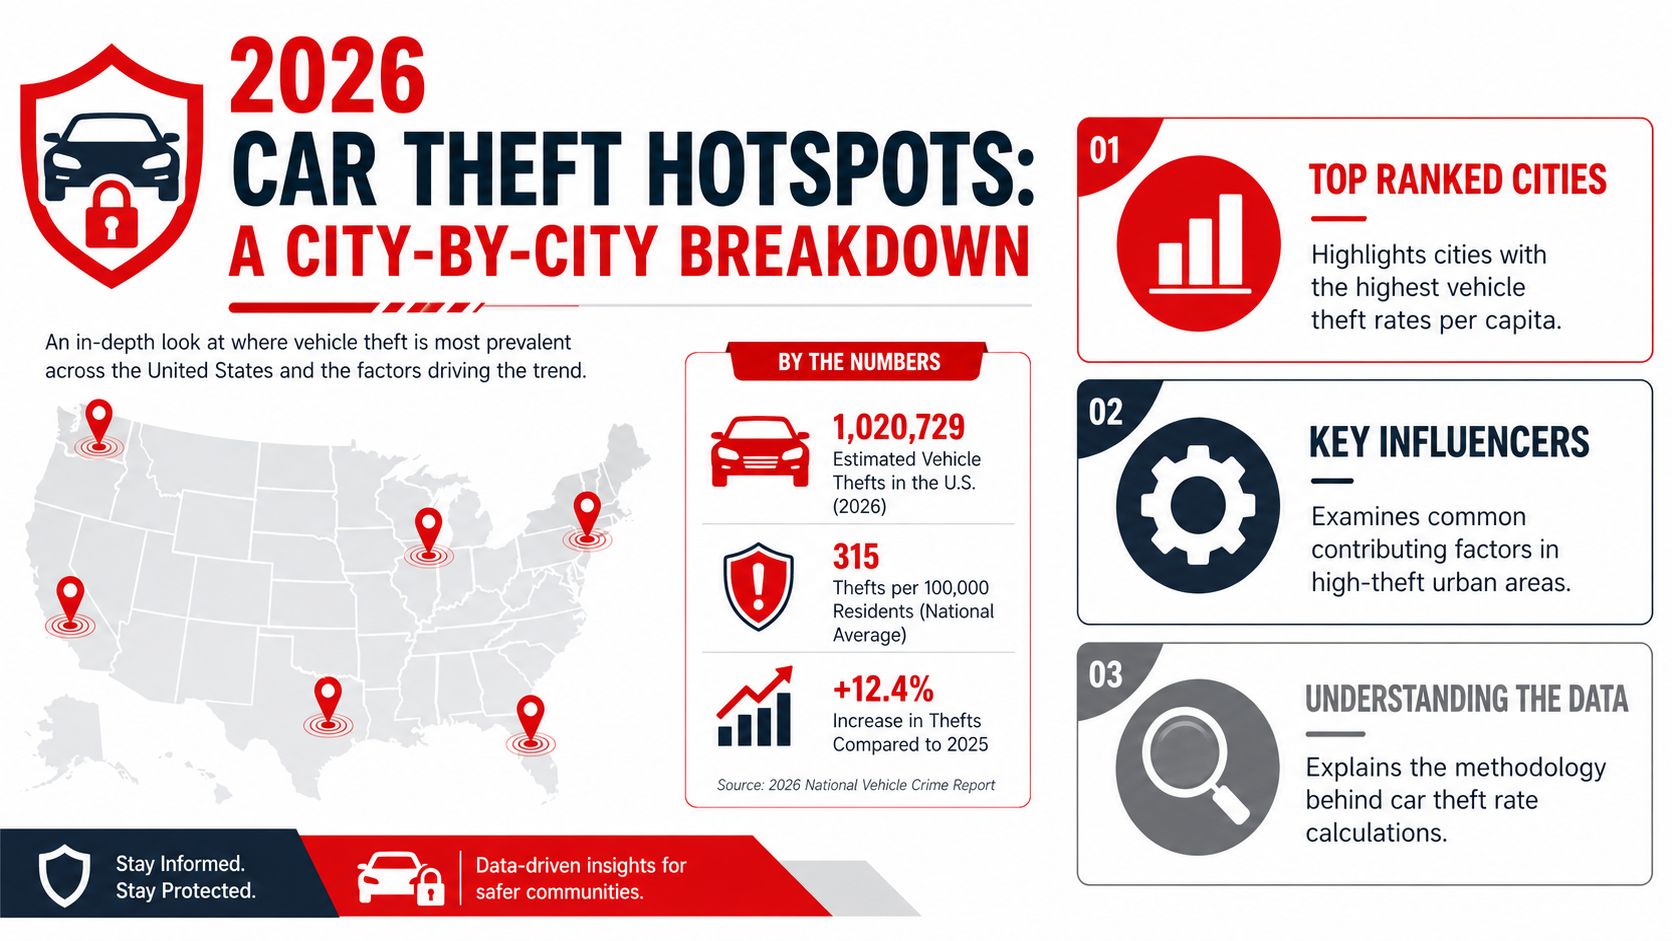
Recent city-level rankings show several places still deserve sustained attention. Milwaukee, Wisconsin, stands out at 380 stolen vehicles per 100,000 residents, identified as the highest rate in that ranking and one of the few cities that saw increases from 2023 to 2024. Kansas City, Missouri, posted 393.81 per 100,000 with only a 2.4% decline, according to The Zebra’s city theft analysis. Those are different patterns, but they point to the same conclusion: modest improvement doesn’t necessarily change the day-to-day threat picture.
Snapshot of notable city hot spots
| City | Theft rate per 100,000 residents | Recent trend | Risk reading |
|---|---|---|---|
| Milwaukee, WI | 380 | Increase from 2023 to 2024 | Persistent pressure with worsening momentum |
| Kansas City, MO | 393.81 | 2.4% decline | Still very elevated despite slight improvement |
| Indianapolis, IN | 305 | 1.4% drop | Little relief for owners on the ground |
| San Jose, CA | 308 | 16% improvement | Improving, but still among higher-risk major cities |
| Raleigh, NC | 150 | 23.4% increase | Lower absolute rate than peers, but sharp movement upward |
This table highlights an issue that broad rankings often hide. Trend direction changes the meaning of the same rate. A city with a high rate and strong improvement may call for one response. A city with a lower rate but a sharp recent increase may call for closer monitoring if you live or park there regularly.
What stands out in the data
Milwaukee and Kansas City deserve attention for different reasons. Milwaukee’s ranking reflects continued severity plus worsening movement in the short term cited in the available city-level data. Kansas City’s rate is even higher in the verified dataset, but the decline is modest enough that an owner shouldn’t treat it as a solved problem.
Indianapolis illustrates another risk category. A rate of 305 per 100,000 with a 1.4% drop suggests the environment is barely changing. For a driver, that means habits matter more than headlines. If local conditions aren’t improving meaningfully, the burden shifts to parking discipline, layered security, and faster detection.
San Jose shows the opposite pattern. The city recorded 308 per 100,000 despite a 16% improvement. That’s useful context because improvement can reduce urgency for policymakers while still leaving individual owners in a high-exposure environment.
National city patterns behind the list
The city-specific rankings sit inside a broader trend. Across 34 cities, 33 reported drops from 2024 to 2025, with San Francisco down 45%, while Boston stayed flat in the verified CCJ data. But the same dataset shows 21 cities remained above 2019 levels, including New York, which was up 143% over that longer period. The lesson is simple: recent cooling hasn’t erased the post-pandemic reset.
Cities can improve quickly from an extreme peak and still remain structurally riskier than they were before theft surged.
How to use city rankings if you own, manage, or move vehicles
A city ranking becomes useful when you match it to actual exposure:
- Daily commuters should focus on where the car sits during work hours, not just on the home ZIP code.
- Apartment residents need to think about overnight visibility, gate discipline, and lot access points.
- Business owners should review after-hours vehicle movement, weekend parking patterns, and whether keys or fobs are centralized.
- People relocating should compare a destination city’s trend direction as closely as its current rank.
For drivers who want a more immediate way to respond when a vehicle moves unexpectedly, a car locator tool can help convert static city risk into something operational: knowing where the vehicle is, and noticing when it isn’t where it should be.
Key Factors Fueling High Theft Rates in Cities
High theft cities rarely have one single problem. They usually have a workable mix of opportunity, vulnerable vehicles, and locations where thieves can act fast and disappear into traffic, parking inventory, or connected road networks.
The vehicle itself matters more than many owners realize. In 2022, Pueblo, Colorado, recorded the highest motor vehicle theft rate among U.S. metropolitan statistical areas at 1,086.4 thefts per 100,000 residents, and the verified data ties that result in part to opportunistic thefts involving high-demand Kia and Hyundai models with immobilizer vulnerabilities that helped place those models at the top of national theft lists in 2023, as noted in Deep Sentinel’s summary of NICB-based theft statistics.

Vehicle vulnerability changes city risk
This is one reason city averages can mislead. If a metro area has a large concentration of particularly easy-to-steal models, the local rate can rise sharply even if other environmental factors are stable. That doesn’t mean every owner faces the same threat. It means owners of vulnerable models face more acute exposure inside the same geography.
For insurers and risk analysts, that’s a key distinction. Theft concentration often emerges where model mix and opportunity overlap. A thief doesn’t need the whole city to be easy. They need enough accessible targets in predictable locations.
Stolen vehicles aren’t always the end goal
The verified CCJ data notes that stolen vehicles are often used to facilitate other crimes. That matters because it changes the speed of the theft event. A vehicle taken for resale, stripping, temporary criminal use, or transport into another area may move quickly. The window for intervention can be short.
That’s why time matters so much after a theft starts.
Faster awareness improves your options. Waiting until the morning after a theft can mean the vehicle is already far from the original location.
The verified data also states that rapid reporting within 24 hours yields a 34% same-day recovery rate for passenger vehicles, with over 85% overall recovery in 2023. Those figures don’t guarantee an outcome for any individual owner, but they strongly support one operational lesson: the sooner you know, the sooner you can act.
Urban conditions amplify opportunity
Some drivers look for a single social explanation for city theft rates. That usually oversimplifies the problem. In practice, urban theft risk tends to rise where several conditions overlap:
- Dense parking supply: Large apartment lots, street parking, transit-adjacent curb space, and retail lots create anonymity.
- Predictable routines: Commuter schedules and long overnight parking windows make targets easier to study.
- Escape routes: High-connectivity road systems help thieves move quickly after entry or ignition.
- Target clustering: Fleets, similar model concentrations, and poorly monitored lots reduce effort per attempt.
These conditions don’t cause theft on their own. They reduce friction for the offender.
Why connected security matters in this environment
Traditional visible deterrents still help. Locked doors, clean interiors, and careful parking all remove easy opportunities. But modern city theft often rewards speed. The security advantage now comes from shortening the time between suspicious activity and owner awareness.
A connected car security system fits that reality better than a purely local alarm because it treats a theft attempt as an information problem, not just a noise event. If a car vibrates, starts unexpectedly, or moves outside normal patterns, the owner needs immediate notice, not just a siren that no one nearby responds to.
Beyond the Headlines Identifying Hyper-Local Risk Zones
City rankings are useful. They’re also incomplete. Some of the most important risk signals sit below the city level, in smaller municipalities, border zones, industrial strips, retail corridors, and suburb-to-city connectors that broad rankings barely capture.
That’s why the strongest reading of car theft statistics by city includes a second layer: micro-hotspots. Verified data from SafeWise notes that smaller cities such as Tukwila, WA, and Emeryville, CA can reach theft rates up to 17 times the national average, a level often missed in broad city comparisons, as summarized in this SafeWise review of local car theft hot spots.
Why smaller places can carry outsized risk
A suburb can look safe in reputation and still produce concentrated theft activity. That happens when a smaller jurisdiction combines retail parking, highway access, warehouse districts, airport spillover, or a large share of unattended vehicles relative to resident population.
The risk is practical, not academic. A driver may live in a lower-risk neighborhood but work in a micro-zone with repeated theft opportunity. Fleet managers run into the same problem when vehicles are stored in edge-of-city industrial areas that don’t resemble the city’s headline crime profile.
Questions that reveal your true exposure
Instead of asking only “Is my city bad for theft?”, ask:
- Where does the car spend the night? Home parking conditions matter differently from work parking.
- Where does it sit the longest? Long dwell time creates opportunity.
- Does your route pass through known commercial or industrial strips? Repetition creates predictability.
- Are you crossing municipal boundaries often? Adjacent areas can have very different theft environments.
A route-level view can be more useful than a city label. Owners who review route history data can often spot patterns they hadn’t thought much about before, such as regular overnight street parking, repeated stops in poorly monitored areas, or weekend exposure at a secondary location.
The highest-risk parking spot in your week may not be near your home. It may be the place you trust because you visit it often.
How to act on hyper-local risk
If your city is improving overall, that’s good news. It doesn’t eliminate the need for local judgment. Focus your strongest precautions on the places where your vehicle is unattended longest and where passerby attention is weakest.
That often means changing routine before buying new gear. Move to a more visible parking row. Avoid leaving the vehicle in the same isolated corner repeatedly. Check whether a “short errand” location has become a predictable unattended stop. Small operational changes can reduce the convenience that many thefts depend on.
Building Your Proactive Vehicle Defense System
Good vehicle security starts with ordinary discipline. Most owners know the basics, but the basics matter because thieves still prefer convenience. A car that’s locked, emptied of visible valuables, and parked in a visible location is more work than the one beside it.
That said, city theft patterns now reward a more layered approach. The right question isn’t “How do I make theft impossible?” It’s “How do I increase friction early, spot suspicious activity fast, and improve the odds of interruption or recovery?”
Start with environment and habit
The first layer is physical routine:
- Choose visibility over convenience. A space near entrances, lighting, or active foot traffic is usually better than an isolated corner.
- Remove cues that suggest a quick payoff. Bags, charging cables, tools, and even loose change can invite entry.
- Vary predictable storage habits. Don’t leave spare keys, access devices, or documents in standard hiding places.
- Think beyond the driveway. Gym lots, airport parking, work sites, and apartment overflow areas often deserve the most caution.
For owners with limited covered parking, vehicle storage itself can be part of risk control. If you’re evaluating enclosed options or seasonal storage ideas, resources on portable garages in Savannah, GA can help you think more concretely about reducing visibility and environmental exposure for vehicles that sit for long periods.
Add detection, not just deterrence
Traditional deterrents still have value because they force a thief to spend more time. But detection is what changes the owner’s position. A local alarm may attract attention, or it may not. A connected system that notifies the owner directly is stronger because it creates a chance to respond while the event is still unfolding.
The most useful alert categories are straightforward:
- Vibration alerts help flag break-in attempts or tampering.
- Engine start notifications show unauthorized use quickly.
- Movement alerts matter when the vehicle shouldn’t be moving at all.
- Geofencing helps identify departures from expected zones.
These tools work best when they match real routines. A vehicle parked nightly at one address and driven on a narrow schedule benefits from tighter rules than a family car used unpredictably all week.
Build response into the system
A security setup is only as good as the response behind it. Decide in advance what you’ll do if you get an alert at night, during work, or while traveling. Keep registration, plate details, and current photos accessible. Make sure every household driver knows who receives alerts and who is authorized to move the vehicle.
A few practical steps make the difference:
- Save critical vehicle details where you can reach them quickly.
- Label normal exceptions such as service visits or valet parking so alerts don’t become background noise.
- Review alerts regularly so you can distinguish routine use from suspicious patterns.
- Treat repeated minor anomalies seriously. Tampering often appears before an actual theft.
The aim isn’t paranoia. It’s shortening decision time when something unusual happens.
Custom Security Strategies for Your Specific Needs
The same city statistic means different things to different owners. A parent, a fleet manager, and a classic car owner don’t experience theft risk in the same way, even if they live on the same block.
The parent with a new teen driver
For a parent, vehicle security often overlaps with driver safety. The concern isn’t only theft from a driveway. It’s also where the car is parked after school, whether it’s moved late at night, and whether the family would know quickly if unauthorized use occurred.
A connected alert system helps by turning the family vehicle into a monitored asset rather than a blind spot. If the car starts unexpectedly, moves outside normal hours, or shows unusual driving behavior, the parent gets an actionable signal instead of discovering the problem later.
The small business fleet manager
Fleet exposure is different because routine itself creates risk. Work vans, service vehicles, and pooled company cars often sit in lots after hours, hold tools or equipment, and may be accessed by multiple drivers. That creates ambiguity, and ambiguity helps theft go unnoticed.
A fleet manager benefits most from clear boundaries. Which vehicles should move after hours? Which address counts as normal overnight storage? Who receives alerts if one vehicle leaves unexpectedly on a weekend? These are operating questions first and theft questions second.
A fleet is rarely lost in one dramatic event. Loss often starts with weak visibility around ordinary use.
The owner of a high-value or classic car
This owner often faces a different kind of stress. The vehicle may be driven rarely, stored carefully, and irreplaceable in practical terms even if insurance responds financially. For that driver, early warning matters as much as recovery.
Sensitive vibration alerts, start detection, and location awareness make sense because any unscheduled activity is significant. A classic or specialty car shouldn’t blend into normal background motion. The smaller the normal use window, the easier it is to treat unexpected alerts as serious.
The apartment resident in a “better” area
This owner often gets false reassurance from city reputation. The building may sit in a district that feels stable, but a shared garage, open lot, or poorly monitored side street can still create concentrated opportunity. Here the issue is less “bad city” and more “bad parking environment.”
The right response is to secure the routine, not argue with the city label. Use the most visible spot available, avoid leaving the car idle for long stretches without checks, and make sure suspicious motion won’t go unnoticed until the next morning.
From Statistics to Security Taking Control of Your Vehicle's Safety
A city theft ranking is only useful if it changes what you do next. The strongest takeaway from this analysis is practical: risk is uneven, often concentrated around specific parking patterns, vehicle types, and short windows of low visibility. A citywide average can alert you to exposure, but it cannot tell you whether your own vehicle is easy to target tonight.
That is why effective prevention starts with narrowing the problem. Match the public statistics to your actual conditions. Consider the model you drive, where it sits overnight, how often it stays unattended, and how quickly you would know if someone opened it, started it, or moved it.
Those details determine whether you are relying on hope or on detection.
For many owners, the biggest failure point is not the initial theft attempt. It is the delay between the event and the moment someone notices. That delay gives thieves time to leave a garage, cross a city line, switch plates, or park the vehicle in a low-profile staging area before any response begins. Early awareness changes that timeline, which is why layered protection works best when it includes both physical deterrence and immediate alerts.
For owners who want to translate statistical risk into a practical defense, CARLOCK provides direct alerts for vibration, engine starts, and vehicle movement, along with GPS tracking through a mobile app. It is designed for drivers, families, and fleet operators who prefer immediate awareness over discovering a problem hours later.
The goal is straightforward. Use the numbers to identify exposure, then put systems in place that reduce the chance of an unnoticed loss.